You can't debug what you can't see: shipping the Vector / AI tab for valkey-search and RediSearch
Why FT.INFO and INFO commandstats aren't enough for production vector workloads on Valkey or Redis - and how BetterDB's new Vector / AI tab closes the gap.

If you're running valkey-search or RediSearch in production, you know the feeling. Something feels slow. You open your monitoring tool. You see CPU, memory, ops/sec. You see generic command counts. And none of it tells you whether FT.SEARCH is the reason.
That's the blind spot. And as of today, it's closed - on both Valkey and Redis.
The blind spot nobody talks about
Vector search is the most important workload to land on in-memory stores in the last year. RAG pipelines, semantic caches, recommendation engines - they all hit the same small set of commands: FT.SEARCH, FT.CREATE, FT.INFO. And yet every generic Valkey or Redis monitoring tool treats those commands as opaque strings, lumped in with GET and HSET in a single "ops/sec" number.
The tools the engine gives you natively aren't much better for production debugging - and this is true whether you're on Valkey with valkey-search or on Redis with RediSearch, because the command surface is nearly identical:
FT.INFOtells you the state of an index right now. Doc count, memory, failures - all point-in-time. You can't ask "when didhash_indexing_failuresstart climbing?"INFO commandstatsgives you cumulative counters since the last restart orCONFIG RESETSTAT. Useful for a single snapshot, useless for trend analysis.- Neither survives a restart. Neither tells you what happened at 3am.
So you end up doing what everyone ends up doing: running FT.INFO in a loop, grepping output, comparing numbers by eye. Or worse, you find out about a broken index because users complain about bad recall.
We built the Vector / AI tab because we hit this ourselves. It's now live in BetterDB Monitor.
What you get
Four things, all automatic, all zero-configuration.
A dedicated tab for your search workload. Vector / AI sits in the monitor sidebar alongside Slowlog, Clients, and Latency. It appears automatically when BetterDB detects a Search module on your instance - valkey-search on Valkey, RediSearch on Redis, doesn't matter. Same tab, same charts, same table. No loaded module, no tab. No dropdowns to set up.
FT.SEARCH load over time. The monitor now polls INFO commandstats continuously in the background and persists the deltas as time-series data. You get the same kind of chart for search traffic that you already have for memory and ops - except this one tells you whether your RAG pipeline just got busier, or your new index is slowing everything down.
Vector index health at a glance. Every index on your instance is listed with its doc count, how many documents are still indexing, how many have been deleted and not yet compacted, and whether any have failed. Rows with failures are flagged. You don't have to remember which FT.INFO field to check - the ones that matter are surfaced automatically.
A commandlog that's actually readable for search traffic. FT.SEARCH queries carry vector embeddings as binary PARAMS blocks. Before this release, those showed up in the commandlog as garbled bytes, which meant search commands couldn't be grouped or searched. They're now replaced with <blob> in the displayed output, and FT.* commands are excluded from the key-prefix aggregation that makes sense for GET/HSET traffic but produces nonsense like idx_cache: for index operations.
What you see in the tab
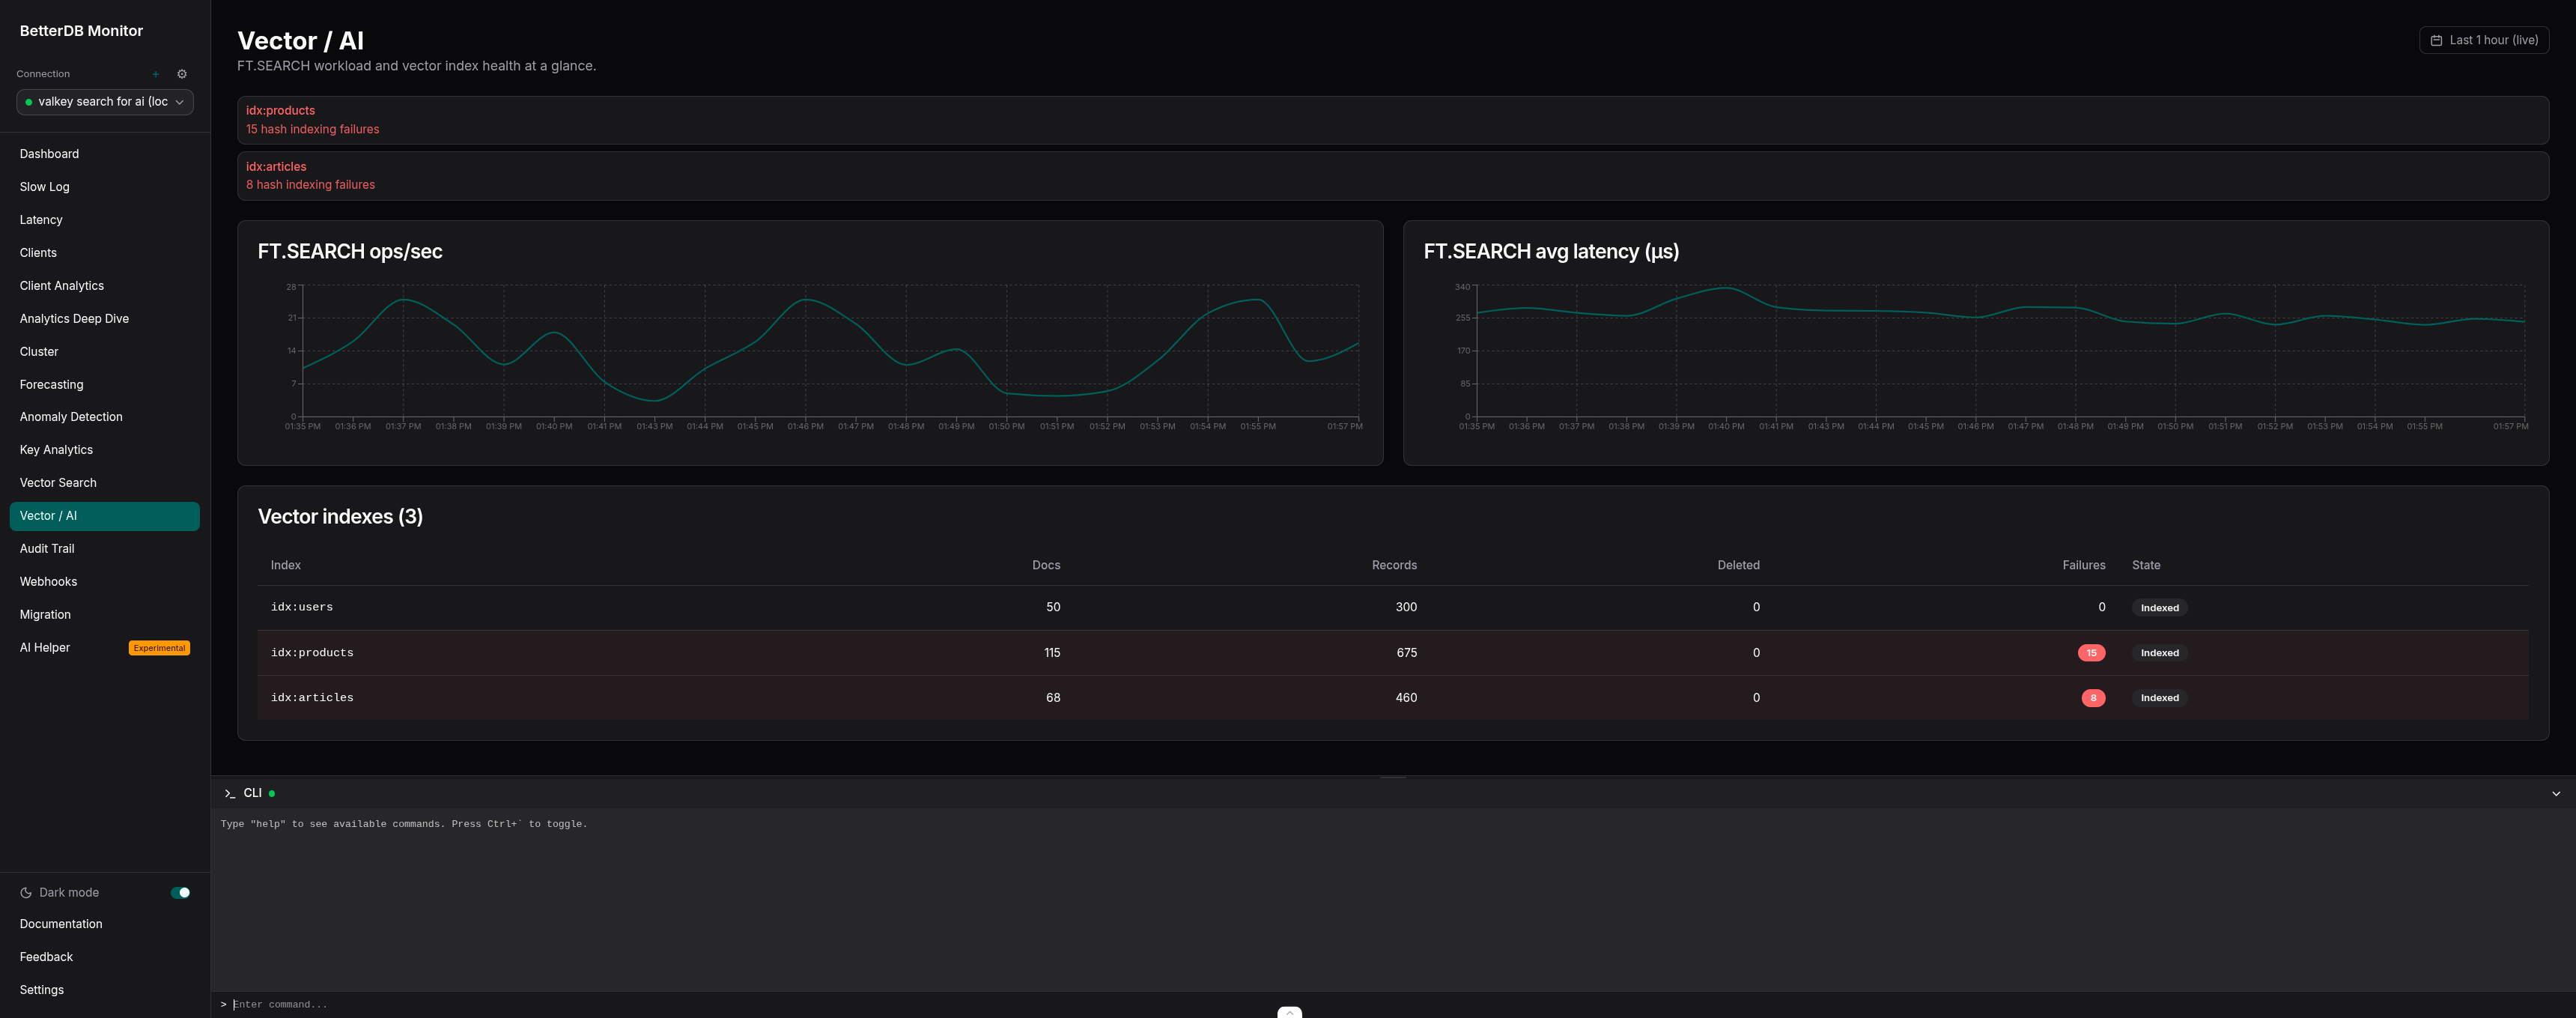
Two line charts at the top, both sourced from the new commandstats history endpoint:
FT.SEARCHops/sec - derived fromcalls_delta / interval_secondsper sampleFT.SEARCHavg latency (µs) - derived fromusec_delta / calls_deltaper sample
The first poll establishes a baseline. Data starts appearing on the second poll, so there's a ~60 second window on startup before the charts populate. After that, new samples land every 15 seconds.
Below the charts, a Vector indexes table shows every index on the connection: doc count, record count, deleted doc count, indexing failure count, and current state (Indexed, or Indexing… with a percentage). Rows with failures get a destructive tint. Three alert banners surface at the top when the data warrants it:
hash_indexing_failures > 0on any index - something is failing to index and you should look at itpercent_indexed < 100while the state is notindexed- an index is actively backfillingnum_deleted_docs > 0and accumulating - uncompacted deletions piling up, likely needs anFT.DROPINDEX+ recreate
That last one in particular is the kind of thing you never catch until someone notices recall degrading. Now it's a banner.
How the gating works
The tab is gated on a capability called hasVectorSearch, which is probed once per connection during BetterDB's existing detectCapabilities() step. The probe is a single FT._LIST call - a command that exists in both valkey-search and RediSearch with identical semantics. If it returns an array - including an empty one - the capability is set and the tab shows up. If the command throws (because the module isn't loaded, or because a managed service like ElastiCache Serverless has restricted it), the tab stays hidden.
No feature flags. No checkboxes in a settings panel. The product adapts to what your instance can actually do - and since BetterDB speaks Valkey and Redis interchangeably, the same monitor works whether you're on vanilla Valkey, ElastiCache, MemoryDB, Redis OSS, Redis Cloud, or Redis 8 with modules.
The same probe also gates the commandstats and vector-index pollers server-side, so instances without a Search module don't pay the polling overhead. That matters if you're running BetterDB across a fleet where only some instances have search loaded.
Prometheus metrics
If you've already got BetterDB wired into Grafana via /prometheus/metrics, six new gauges will start appearing automatically.
Per-index health:
betterdb_vector_index_docs{connection="...", index="..."} 100
betterdb_vector_index_memory_bytes{connection="...", index="..."} 26214400
betterdb_vector_index_indexing_failures{connection="...", index="..."} 0
betterdb_vector_index_percent_indexed{connection="...", index="..."} 100
Per-command stats:
betterdb_commandstats_calls_total{connection="...", command="ft.search"} 1523
betterdb_commandstats_latency_us{connection="...", command="ft.search"} 29700
Stale labels are cleaned up automatically. If an index is dropped or a command disappears from INFO commandstats (typically after a CONFIG RESETSTAT), the corresponding gauge is removed on the next poll cycle. No zombie series clogging up your Grafana.
A few queries worth keeping around:
# Alert when any index starts failing
max by (connection, index) (betterdb_vector_index_indexing_failures) > 0

# Alert on FT.SEARCH p99 latency drift (needs a histogram, but avg is a starting point)
rate(betterdb_commandstats_latency_us{command="ft.search"}[5m])
  /
rate(betterdb_commandstats_calls_total{command="ft.search"}[5m])
The short version
Vector search is a first-class workload now. The tools around it haven't caught up yet. FT.INFO gives you a snapshot, INFO commandstats gives you counters, and neither gives you the one thing you actually need: what has been happening to my search workload over time?
BetterDB's Vector / AI tab gives you that, with zero configuration, surfaced next to the rest of your monitoring. If your instance has a Search module loaded - valkey-search or RediSearch, it doesn't matter - the tab appears. If it doesn't, it stays out of the way.
You can try it on BetterDB Cloud in two minutes, or pull the Docker image and self-host. Point it at Valkey, Redis, ElastiCache, MemoryDB, Memorystore, or Redis Cloud - they all work.
If you're running RAG or semantic search in production and you've been flying blind on the search side of things - this is for you. And if there's something we're missing, tell us. We'll build it.
BetterDB is observability for Valkey and Redis, with a caching layer for AI agents on the side. Works with vanilla Valkey 7+, Redis 6.2+, ElastiCache, MemoryDB, Memorystore, and Redis Cloud. The monitor is free during early access. The source is on GitHub.