We benchmarked our semantic cache against Upstash. The thresholds did not transfer.
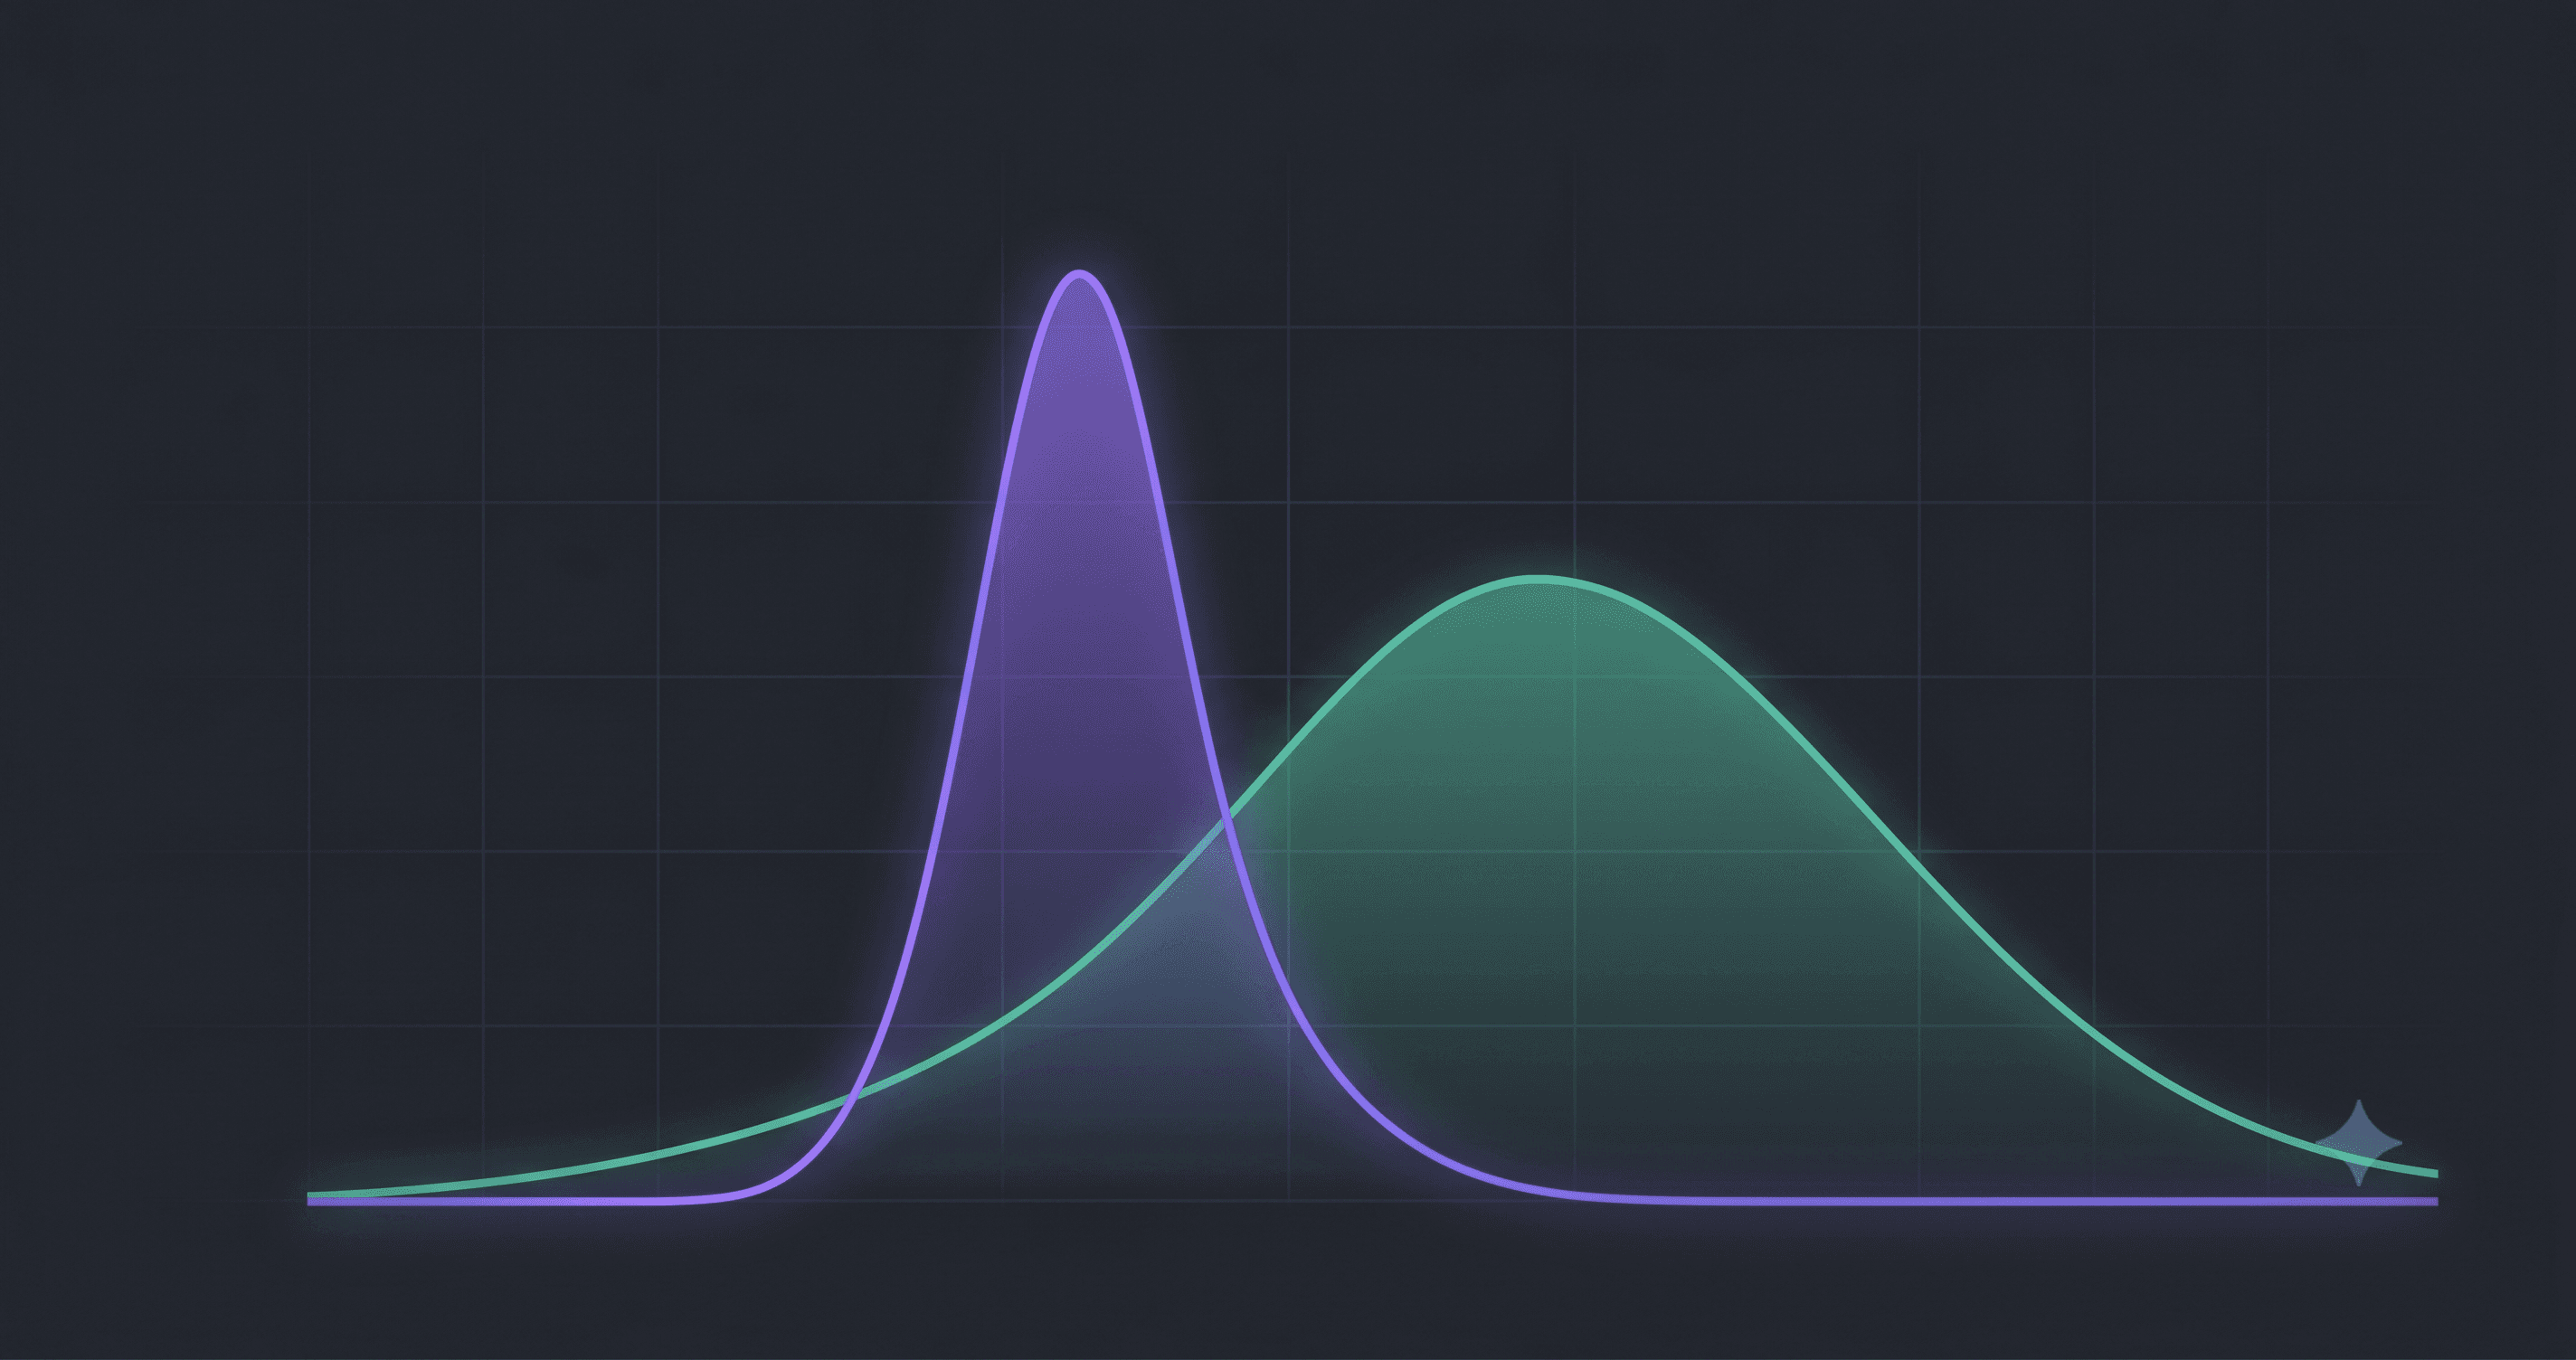
BetterDB vs @upstash/semantic-cache on four public datasets. Quality is at parity. The same embedding model produced different score distributions on each runtime, so the optimal threshold was different on each side, which is the whole argument for self-tuning. Latency is local Valkey vs a cloud REST API, so we report it as a deployment difference, not a library win. And BetterDB ships OpenTelemetry, Prometheus, and dollars-saved tracking in the MIT library, where Upstash ships none of it.
In the RedisVL post we promised an npm-side comparison against the one vendor-shipped TypeScript semantic cache. This is it.
A note before the numbers
The two caches we benchmark in this series are shipped by the company that invented the category (Redis Inc.) and by a serverless vector vendor with deep reach into the Vercel and edge ecosystem (Upstash). We are a newer and smaller library than either. We are also not strangers to this ecosystem: before BetterDB I spent a year at Redis building their developer tooling, so the conventions a Redis-compatible library has to get right are familiar ground.
We ran against both on public datasets and matched them on quality, and pulled ahead where the library actually gets to make a decision. On the dataset that looks most like real chatbot traffic we are ahead by 1.3 points of F1. On the rest we are not behind anywhere, which on a fixed embedding model is exactly the result to expect.
That last part is worth being clear about, because it is the thing most vendor benchmarks hide. Cache quality on semantic caching is bounded by the embedding model, not the library. Fix the model and every honest implementation is doing cosine distance against a threshold, and they converge. So parity is the ceiling. Reaching it is the price of admission, and we reach it. Then we pull ahead in the places where the library actually gets to make decisions: tuning the threshold to your runtime, telling you what the cache costs and saves, and emitting the telemetry you would otherwise build yourself. The F1 number is not where this is won, and we will show you exactly why below.
The short version
- Quality (F1): parity. Within 0.0 to 1.3 percentage points at each adapter's peak across all four datasets. With self-tuning on, BetterDB edges ahead on the one realistic chatbot dataset (+1.3pp).
- Thresholds do not transfer between runtimes. Same embedding model name, different runtime, different score distribution. Upstash's scores clustered in [0, 0.26]; ours in [0, 0.50]. Upstash peaked at threshold 0.10, we peaked at 0.20. A threshold copied from a tutorial or a competitor's default is wrong for your deployment.
- Latency: BetterDB was 48 to 136x faster on these runs, but this is local Valkey vs a cloud REST API. It is architectural, not algorithmic, and we say so plainly below.
- BetterDB ships observability and cost tracking in the library, and self-tuning for free. OpenTelemetry spans, Prometheus metrics, and dollars-saved per hit are in the MIT library. The self-tuning loop runs through Monitor, which is free. Upstash ships none of these.
- Everything here is open source and runs on infrastructure you already control. MIT libraries on Valkey or any Redis-compatible endpoint, seven framework adapters, five embedding providers, no coupling to one vendor's cloud.
If you only have a minute, that is the story.
Why Upstash is the right TypeScript peer
@upstash/semantic-cache is the only vendor-shipped TypeScript semantic cache library we are aware of. It is the natural counterpart to the RedisVL comparison: RedisVL is the Python peer, Upstash is the TypeScript one. The shapes match (embed, store, similarity lookup against a threshold), and the backend coupling differs (Valkey for us, Upstash Vector for them). That difference is also what makes the comparison interesting, as you will see.
We benchmarked @betterdb/semantic-cache (npm, PyPI) on local Valkey 8 against @upstash/semantic-cache on Upstash Vector (cloud, EU region).
A note on what "same model" means here
Both adapters use bge-small-en-v1.5 by name. They do not use the same runtime. BetterDB embeds locally with ONNX. Upstash embeds server-side. Same weights, different execution, and the output similarity distributions are not the same.
This matters for reading the tables. Upstash's scores landed in [0, 0.26]. Ours landed in [0, 0.50]. You cannot compare a BetterDB threshold of 0.20 to an Upstash threshold of 0.20, because 0.20 means something different in each distribution. The only fair comparison is peak F1 at each adapter's own optimal threshold, which is how every table below is built.
Datasets
Four public datasets, the same ones used across this series:
- STSb (5,000 pairs): news headlines, captions, forum text with continuous human similarity scores. Spread out, lots of ambiguous middle.
- SICK (9,927 pairs): short compositional sentence pairs. Clean separation between matches and non-matches.
- PAWS-Wiki (8,000 pairs): adversarial paraphrases that share most words but mean different things. The wall.
- SemBenchmarkLmArena (5,000 pairs): real chatbot prompts from the vCache paper (ICLR 2026), grouped into equivalence classes. The closest thing here to a production AI workload.
Quality: peak F1 across all four datasets
Peak F1 at each adapter's own optimal threshold. Thresholds are not comparable across columns, only the peaks are.
| Dataset | Upstash (peak) | BetterDB bare | BetterDB autotune | Best BetterDB vs Upstash |
|---|---|---|---|---|
| STSb | 75.9% (θ=0.10) | 76.3% (θ=0.20) | 76.3% (θ=0.20) | +0.4pp |
| SICK | 77.6% (θ=0.30) | 77.7% (θ=0.50) | 77.7% (θ=0.50) | +0.0pp |
| PAWS-Wiki | 61.3% | 61.3% | 61.3% | 0.0pp |
| SemBenchmarkLmArena | 70.1% (θ=0.10) | 70.7% (θ=0.20) | 71.4% (θ=0.20) | +1.3pp |
Read it honestly: this is parity, and on a fixed embedding model that is the expected result. The largest gap is 1.3pp, on the one dataset that looks like real chatbot traffic, and it comes from self-tuning finding the right threshold rather than from a better lookup. On SICK and PAWS the two libraries are indistinguishable. On STSb the gap is inside the noise. The lookup is solved. What you do around it is not.
The finding that matters: thresholds are not portable
Here is the part the RedisVL benchmark could not show, because RedisVL ran on the same engine and runtime we did, so the distributions were identical.
Upstash and BetterDB used the same model name and produced different score distributions. As a result, the optimal threshold was different on each side: 0.10 for Upstash, 0.20 for us. Neither is "correct." Each is correct for its own runtime.
The implication for anyone running a semantic cache in production: a threshold is not a constant you can look up. It is a property of your specific embedding runtime, your data, and your traffic mix. Copy the number from a blog post, a docs default, or a competitor, and you are very likely running at the wrong cutoff. On SemBenchmarkLmArena our autotuner found 0.20 and gained +1.3pp over Upstash's peak. If you had started that same cache at 0.40, a perfectly reasonable default someone might copy, the autotuner's gain over that starting point would have been +5.5pp. Those are two different measurements and we keep them separate on purpose: +1.3pp is us vs a well-tuned Upstash, +5.5pp is the autotuner vs a bad guess. Both are real. The second is what self-tuning is actually for.
This is the empirical backing for the self-tuning post: the autotuner does not chase a quality ceiling, it removes the requirement that you guess the threshold right for a runtime whose score distribution you have never measured.
Latency: a deployment difference, not a library win
| Dataset | Upstash p50 | BetterDB p50 | Ratio |
|---|---|---|---|
| STSb | 272.3ms | 5.7ms | 48x |
| SICK | 88.8ms | 0.7ms | 135x |
| PAWS-Wiki | 90.7ms | 0.7ms | 136x |
| SemBenchmarkLmArena | 92.5ms | 12.6ms | 7x |
We are not going to dress this up. This is local Valkey against a cloud REST API. We are racing a process on localhost against a network round trip to another region.
The honest version of the claim is still useful: if you run your cache next to your application, on Valkey you operate yourself, you get sub-millisecond lookups that a managed cloud vector API cannot match, because the network hop is structural and not something Upstash can optimize away without shipping a local deployment. If your priority is zero operational footprint and you are fine paying for the round trip, that is a real and reasonable tradeoff in Upstash's favor. If your priority is latency, you want the cache local, and that is the architecture we ship.
Field notes from running the benchmark
Not criticism, just what we hit while testing, in case you hit it too:
- Vector ID cap. Upstash Vector limits vector IDs to 1,000 characters. Long prompts exceeded it, so we hashed prompts before use. Worth knowing if your keys are derived from raw prompt text.
- Backend availability. We saw three instances of backend unavailability mid-run during the benchmark window. Managed services have maintenance and incidents; a local Valkey does not have a backend that can be unavailable to you.
- No local deployment. There is no way to point
@upstash/semantic-cacheat a local instance, which is what produces the latency gap above. - No runtime control of the embedding model. Embedding happens server-side, so the model and its runtime are fixed for you.
What BetterDB ships that neither competitor does
This is where the comparison is decided. Observability and cost tracking are in the MIT-licensed library, no Monitor, no cloud, no license key required. Self-tuning is the one exception: the recommendation is in the library, but the loop that acts on it runs through our Monitor, which is free.
Observability, in the SDK, with no instrumentation
Every check() and store() emits an OpenTelemetry span and updates Prometheus metrics. You wire nothing. With RedisVL or Upstash you build your own observability around a library that emits nothing.
# Prometheus metrics emitted automatically
agent_cache_requests_total            # hits and misses by tier
agent_cache_operation_duration_seconds
agent_cache_cost_saved_total          # estimated dollars saved
agent_cache_stored_bytes_total
agent_cache_active_sessions
Dollars saved, computed from a bundled price table
A semantic cache's entire return on investment is tokens you did not send to the model. So we measure it directly. You store token counts at cache time, and on every hit the library returns the dollars that hit saved, priced from a bundled table sourced from LiteLLM (1,900+ models, refreshed on every release).
const result = await cache.check('Capital city of France?');
// result.hit === true
// result.costSaved === 0.000105   // this hit, in dollars

const stats = await cache.stats();
// stats.costSavedMicros === 12500000   // $12.50 saved cumulatively
The computation is not a marketing counter. It is hit count times stored token counts times the per-model price from the bundled table, and you can override the table or turn it off entirely. We are showing you the mechanism so the number survives scrutiny. Neither RedisVL's SemanticCache nor @upstash/semantic-cache surfaces a savings figure at all.
Self-tuning, recommendation in the library and the loop through Monitor
The recommendation is in the MIT library. thresholdEffectiveness() reads the rolling similarity window and returns tighten, loosen, or optimal, with no external dependency. The full closed loop that acts on it (an agent reads the recommendation over MCP, proposes a change with reasoning, a human approves, the running cache picks it up within a second with no restart) runs through BetterDB Monitor, which is free but not part of the MIT library. That loop is the self-tuning system we benchmarked separately, and it is what solved the threshold-portability problem above without anyone hand-tuning a number. So the split is: the library tells you the threshold is wrong for your runtime, and the free Monitor loop closes it for you.
Open source, and not locked to one vendor
Everything in this comparison is open source, and that is not incidental to how it behaves. The libraries are MIT. They run on Valkey, the open-source fork that exists because Redis relicensed in 2024, and on any RESP-compatible endpoint: self-hosted Valkey, ElastiCache, Memorystore, MemoryDB, or Redis itself. You are not renting a cache from us. You import a library and point it at infrastructure you already run.
Two things follow from that, and both are visible in what the package actually ships.
You are not locked to a framework. The semantic cache ships adapters for seven frameworks, with TypeScript and Python at parity (Vercel AI SDK is TypeScript-only, since that is where it lives):
| Framework | TypeScript | Python |
|---|---|---|
| OpenAI Chat | Yes | Yes |
| OpenAI Responses | Yes | Yes |
| Anthropic Messages | Yes | Yes |
| LangChain | Yes | Yes |
| LangGraph | Yes | Yes |
| LlamaIndex | Yes | Yes |
| Vercel AI SDK | Yes | No |
You are not locked to an embedding provider. Five embedding helpers ship in the box, and you can pass your own embedding function for anything else:
| Provider | TypeScript | Python |
|---|---|---|
| OpenAI | Yes | Yes |
| AWS Bedrock | Yes | Yes |
| Voyage | Yes | Yes |
| Cohere | Yes | Yes |
| Ollama | Yes | Yes |
That second table is not just convenience. Earlier in this post the optimal threshold differed between BetterDB and Upstash because the embedding runtime differed, and Upstash embeds server-side, so you take its runtime and its score distribution as given. Here you choose the provider and control the runtime, which means you control the distribution your threshold is tuned against. Open embedding choice and self-tuning are the same story told from two directions: one lets you pick the runtime, the other adapts to whichever one you picked.
The MIT license is also not a temporary state we can revoke later. BetterDB is a Delaware public benefit corporation operating under the OCV Open Charter, and the commitment to keep our open code open is written into the certificate of incorporation, not just a blog post. That is a deliberate contrast with the rest of the category. Upstash runs on Upstash Vector with server-side embedding, and the managed Redis path runs on Redis Cloud. BetterDB runs on whatever Redis-compatible infrastructure you already have, with the embedding provider you choose.
What is coming
Self-optimization is where most of our current work is going. The propose-and-approve loop shipping today is the conservative first version, with a human in the loop by design. Over the next couple of weeks a batch of additions lands across both cache packages, extending what the cache can observe about itself and what it can safely adjust without a human in the path. The direction is the same one this whole series points at: a cache that measures its own behavior and corrects it, instead of one you configure once and hope you got right. We will benchmark each addition the same way we benchmarked everything here, including the parts where we are only at parity.
What this means if you are picking a cache
Pick @upstash/semantic-cache if:
- You want fully managed serverless vector with zero operational footprint
- You are already on Upstash and want the least infrastructure to run
- You are fine paying a network round trip per lookup
Pick BetterDB if:
- You want sub-millisecond repeated lookups by running the cache next to your app on Valkey
- You want OpenTelemetry, Prometheus, and dollars-saved tracking in the library with no extra wiring
- You want the cache to tune its own threshold to your runtime instead of guessing a number that was measured on someone else's
- You want TypeScript and Python with full parity, on Valkey, ElastiCache, Memorystore, or any Redis-compatible endpoint
- You want an MIT-licensed library with no backend, framework, or embedding-provider lock-in, and a license that is contractually committed to staying open
Pick neither if:
- Your workload looks like PAWS. No cosine-distance cache, ours or anyone's, separates adversarial paraphrases. You need a different architecture.
Reproducibility
All numbers here are reproducible. The benchmark harness, dataset loaders, and adapter code are open source at github.com/BetterDB-inc/monitor/packages/cache-benchmark-ts. STSb, SICK, PAWS-Wiki, and SemBenchmarkLmArena are public. The cost tracking, OTel, and Prometheus features described above are in @betterdb/semantic-cache (npm, PyPI) under the MIT license. The self-tuning closed loop runs through BetterDB Monitor, which is free to use. If you spot something we got wrong, the issues tab is open.