OpenAI runs Valkey for a billion users. Here's how to run yours better.
TL;DR: OpenAI runs Valkey as the cache behind a billion users and 70M requests a second. Here's how BetterDB makes operating that same cache better - persisting the slowlog and latency they worked so hard to keep fast, and catching the hot keys, connection storms, and ACL drift before they page you.
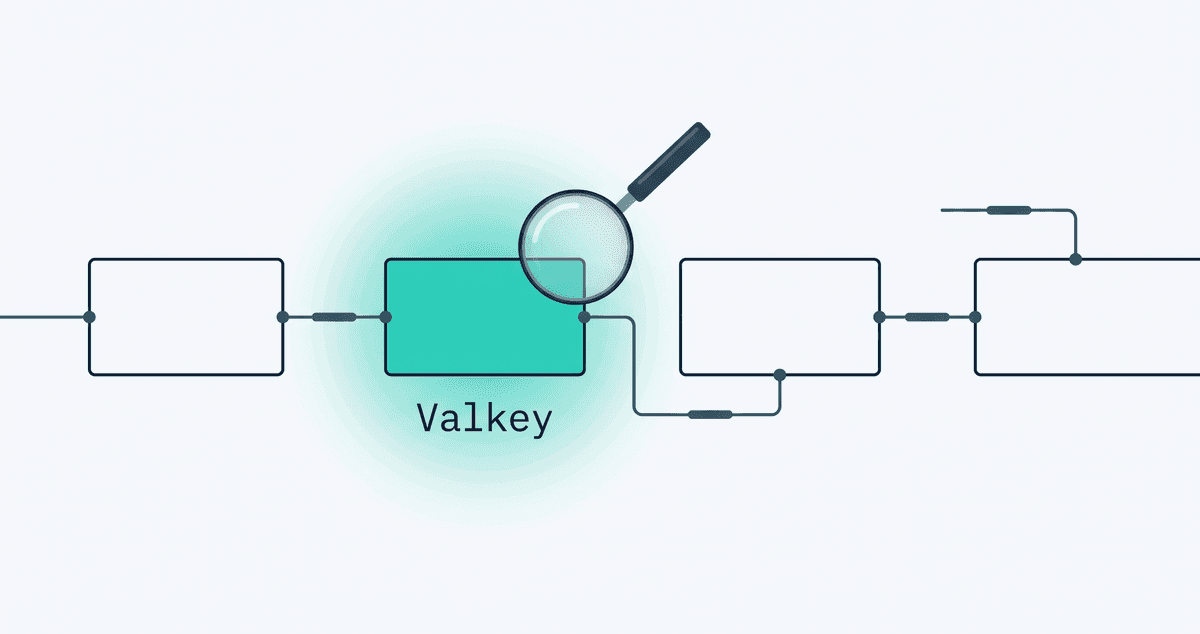
The box in the diagram
OpenAI published a deep dive on how they scaled online storage to a billion ChatGPT users. It's a great post - go read it - and most people will read it for the Python-to-Rust rewrite and the tail-latency war stories. (I could tell you why we went from Python to Go, and a few other languages, back at Redis - but that's a different post.)
You don't have to read far to find the part that stopped me. It's right there on the very first diagram - Figure 01, the one laying out what Habitat is. Under "Storage resources," next to Azure Cosmos DB, Nanobase, and blob storage, there's a box labeled Valkey. Caches.
That's the whole reason I'm writing this. OpenAI is serving 70 million requests a second to over a billion people a week, and their caching layer is Valkey. Not a hosted Redis product with a logo. Valkey. If you've been waiting for someone to prove Valkey belongs in serious AI infrastructure, that diagram is the proof, and it came from the company that would know.
One box, not the whole stack
Let me be honest about scope before this turns into the kind of post that claims a monitoring tool would have saved OpenAI. It wouldn't have. They built Habitat, they built their own tooling, and they rewrote the whole thing in Rust with two engineers and Codex. They are fine.
BetterDB watches exactly one box in that diagram: the Valkey one. Not Cosmos DB. Not Rockset or the CDC pipeline. Not the Habitat service internals, the asyncio event loop, or the 500 petabytes of data underneath it. If someone tells you their Valkey monitor also covers your Cosmos accounts, check your wallet.
But here's the thing that makes their post worth reading with BetterDB in mind: almost every hard-won lesson in it is about a failure mode that also happens on the cache box. They wrote a list of the things that hurt at scale. For the Valkey part of your stack, that list is basically our feature page.
"The slowest call is the one the user feels"
The single best line in the post:
When the average user request results in hundreds of database calls, the slowest database call is the one the user feels.
That's the entire argument for persisting slowlog and latency data instead of sampling a metric. A p99 chart tells you the slowest call happened. It doesn't tell you which command, against which key pattern, from which client - and by the time you're looking, Valkey's SLOWLOG ring buffer (128 entries, default) has already rotated it into oblivion.
BetterDB keeps it. We persist the LATENCY events, we aggregate slowlog entries into command patterns, and we keep the history so the spike at 02:14 is still there when you go looking at 09:00. If the slowest call is the one the user feels, you want the slowest call written down, not averaged away.
And their "Habitat does less" section - the deliberate refusal to allow unbounded queries, because a single expensive query on a hot path takes out the database - has a direct Valkey analog. The expensive KEYS *, the multi-megabyte MGET that's fine on latency but is quietly saturating your network. SLOWLOG catches the slow one. COMMANDLOG, on Valkey 8.1, catches the large one - large requests and large replies - which is exactly the "cheap to write, expensive to run" cost imbalance they're describing, one layer down.
Their failure modes, on the cache side
The middle of the post is a tour of tail-latency incidents. Read them as a cache operator and they get familiar fast.
The metastable connection-pool failure. Theirs was Python's aiohttp defaulting to LIFO connection reuse, which quietly concentrated traffic onto already-overloaded processes until they had to restart pods. The shape - load piling onto the wrong place and staying there - is the shape of half of all cache incidents. On the Valkey side, BetterDB attributes load to specific clients by name and pattern, tracks connection counts and buffer usage over time, and runs a connection-leak detector and an admin-lockout-risk detector (connections held above 85% of maxclients, escalating to critical the instant rejected_connections starts moving). When traffic concentrates where it shouldn't, you see which client is doing it.
The thundering herd. They call out how an order of magnitude more processes makes it trivial to flood downstream dependencies with connections. Point a fleet like that at Valkey and the connection storm lands on the cache. The traffic-burst and connection detectors are watching for exactly that landing.
Hot processes, hot partitions. Their whole partitioning design is about not letting one object-and-edges partition become a hotspot. The cache version is the hot key and the hot slot. BetterDB does hot-key detection - top keys by access frequency, with rank movement over time - and on a cluster, CLUSTER SLOT-STATS heatmaps so you can see the one slot burning CPU before it becomes an incident.
Here's the same list as a table:
| From OpenAI's post | On your Valkey box, BetterDB shows you |
|---|---|
| "The slowest database call is the one the user feels" | Persisted latency events + slowlog patterns, across any time range |
| No unbounded queries; expensive-query cost imbalance | Slowlog + COMMANDLOG large-request/large-reply capture |
| LIFO metastable failure, traffic pinned to hot processes | Per-client load attribution, connection-leak + lockout-risk detectors |
| Thundering herd flooding downstreams | Traffic-burst + connection detectors |
| Hot partitions | Hot-key detection + cluster slot-stats heatmaps |
| Failovers during rolling upgrades | Topology-diff failover detection |
| Security chokepoint, ACLs, audit logging | ACL audit + drift, auth-failure bursts, activity log |
| Running a specific engine version | CVE scanning of engine + modules |
The security chokepoint
One line in their post is worth pulling out on its own. They describe Habitat as the place they "centrally enforce access control policies, perform audit logging, and limit access to underlying storage resources," protecting user data "from external, internal, and agent actors."
External, internal, and agent actors. In 2026 that third category is the interesting one, and it's the same threat model we built the Valkey side around: an MCP server with a read-only allowlist so an AI agent can query your cache's health without being handed a loaded gun. On the audit side, BetterDB keeps a persistent ACL audit trail, detects ACL drift across a replication group (one replica quietly ending up with different rules than its peers), and attributes auth-failure bursts to a client address instead of letting a port-rotating brute force hide in the noise. Same instinct as their chokepoint, scoped to the cache.
Forty regions, one screen
They run across almost 40 geographic regions, with critical data sets on regionally distributed accounts to shrink the blast radius of any single-region outage. If your Valkey footprint looks anything like that - even at a hundredth of the scale - the operational question becomes "are all of them healthy right now," and you can't answer it one dashboard at a time.
That's the Fleet view: every instance rolled into one status, per-region, with memory, ops/sec, replication role, and CVE counts per instance. And because rolling upgrades across that many regions mean routine failovers, the topology-diff detector catches the clean primary-to-replica promotions that leave cluster_state:ok and slip past anything watching only CLUSTER INFO.
You're not building Habitat
Here's the actual takeaway, and it's not "OpenAI should call us."
It's that OpenAI just validated Valkey as a caching layer at the absolute top of the scale curve - and then spent a very long blog post describing the bespoke platform and custom tooling it took to run it well. They had the engineers, their own coding models, and the mandate to build all of that.
You have a Valkey cache and a pager. The failure modes are the same ones - tail latency, connection storms, hot keys, ACL drift, failovers during upgrades - just without the team that gets to build Habitat to handle them. BetterDB is the off-the-shelf version of visibility into that one box: the slowlog and latency history persisted, the anomalies detected, the fleet on one screen, the CVEs cross-referenced.
Run the same cache OpenAI runs. See all of it. Self-host in one command, or try Cloud.