Valkey monitoring and observability
Valkey monitoring is the process of collecting and analyzing the health, performance, command activity, memory, clients, replication, and cluster state of Valkey instances. BetterDB is a Valkey-first monitoring platform that keeps the history Valkey throws away - so you can debug what happened at 3am, not just what's happening now.
Or self-host:
What should you monitor in Valkey?
Whatever tool you use, a production Valkey deployment needs visibility across eight areas:
Memory
Used memory, fragmentation ratio, evictions, key sizes, growth over time.
Latency
Command latency percentiles, latency spikes, and the events behind them.
Commands
Ops/sec, slow commands (SLOWLOG), large requests and replies (COMMANDLOG), command patterns.
Clients
Connected clients, connection churn, blocked clients, and which service caused what.
Keyspace
Hit/miss ratio, expired and evicted keys, hot keys by access frequency.
Replication
Replication lag, link status, and failover events.
Persistence
RDB/AOF status, last save time, and persistence stalls.
Cluster
Topology, slot distribution, migrations, and per-slot load.
What makes Valkey monitoring different from Redis monitoring
Valkey 8.x exposes observability surfaces Redis doesn't have. BetterDB supports all of them natively and falls back gracefully on Redis 6+.
COMMANDLOG
Valkey 8.1+Beyond the slowlog: Valkey also records large requests and large replies. BetterDB persists all three logs and breaks them down by command pattern, so you can spot bulk writes and oversized reads before they hurt latency.
CLUSTER SLOT-STATS
Valkey 8.0+Per-slot key counts, CPU time, and network I/O. BetterDB renders these as cluster heatmaps so uneven slot load and noisy keyspaces are visible at a glance.
Per-thread CPU & I/O metrics
Valkey 8.xValkey's multi-threaded I/O exposes per-thread utilization. BetterDB charts it, which no Redis-era tool can provide.
See what's actually happening inside your Valkey instance
Historical data that survives a log rotation. Client-level attribution. Automatic anomaly detection.
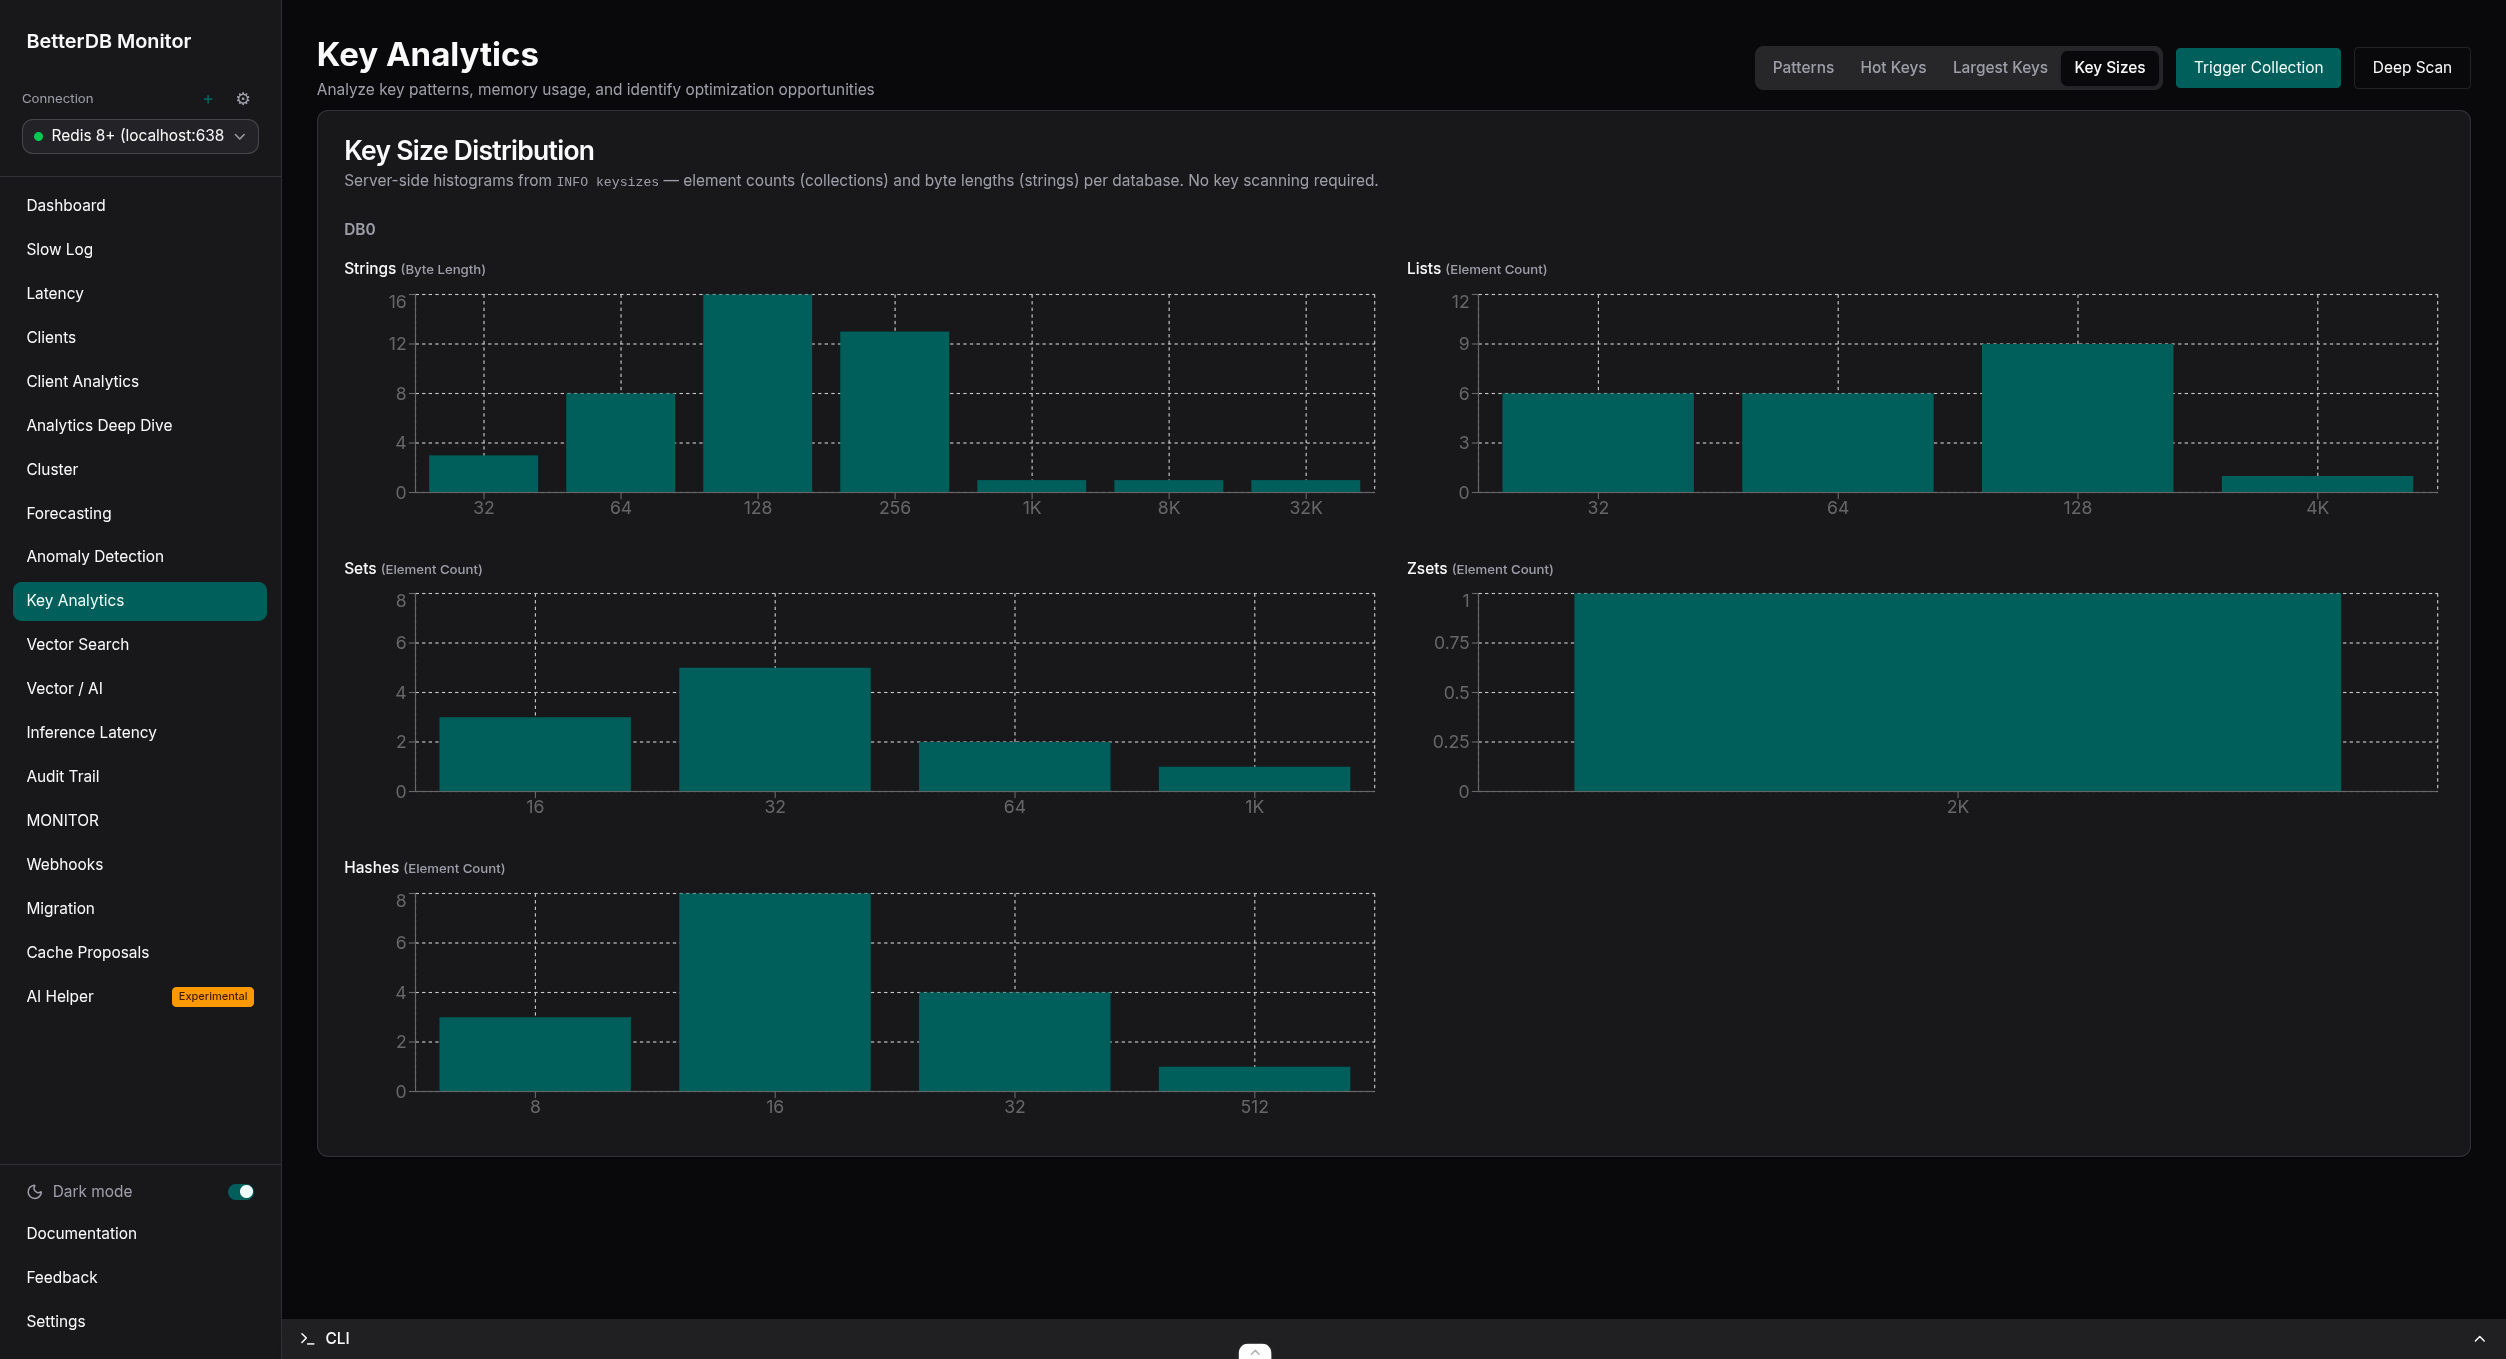
Key size distribution built from server-side INFO keysizes histograms - element counts for collections and byte lengths for strings, per database. No key scanning required.
How BetterDB monitors Valkey
Persistent history, anomaly detection, and cluster visibility with sub-1% overhead.
Everything you need to understand your Valkey or Redis instance
Deep insights into your Valkey or Redis deployment with minimal overhead.
Air-Gapped Deployment
Runs fully offline in air-gapped environments. Offline license tokens are verified locally - no internet access needed, nothing leaves your network.
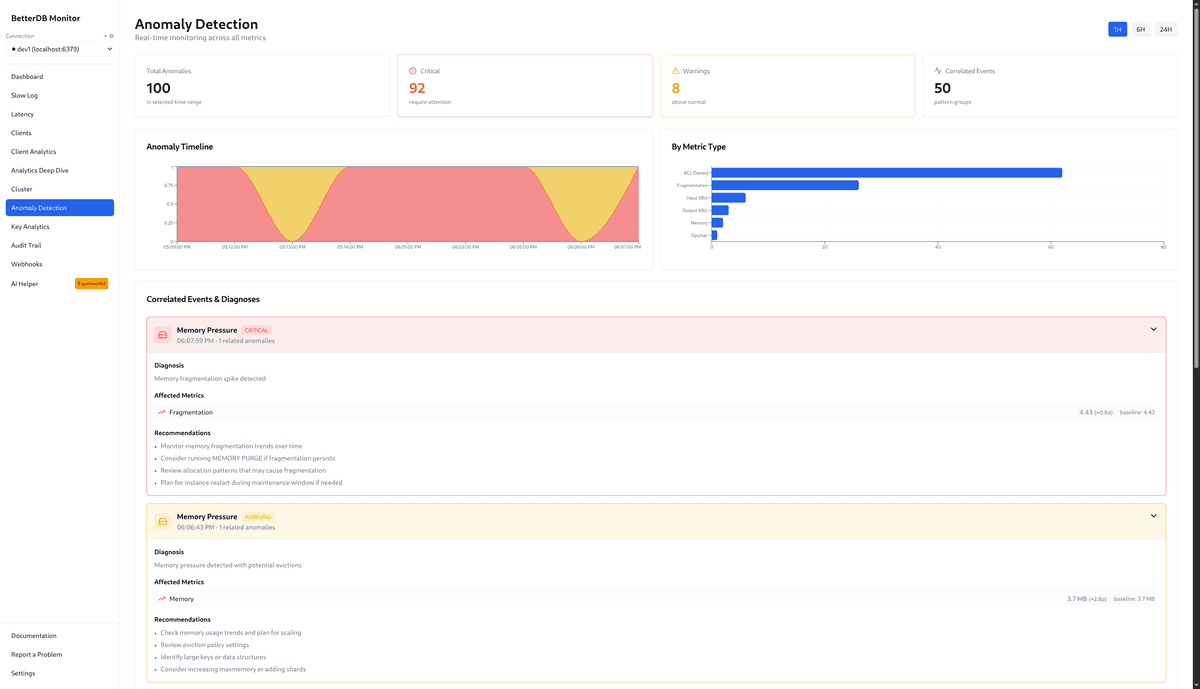
Anomaly Detection
Automatic detection of unusual patterns across memory, CPU, and connections - plus cluster safety guards for split-brain, stuck replicas, and data loss.
See every pattern →Historical Analytics
Query what happened at 3am, not just what's happening now.
Cluster Visualization
Interactive topology graphs, slot heatmaps, and migration tracking.
ACL Audit Trail
Track who accessed what for compliance and debugging.
Slowlog & COMMANDLOG
Pattern analysis across persisted slow queries and full command history. Valkey 8.1+ COMMANDLOG captures every command, not just the slowest ones.
Key Analytics
Analyze key patterns by namespace and key type.
Client Analytics
See which clients consume resources. Detect unusual buffer sizes and connection spikes.
Prometheus & OpenTelemetry
100+ Prometheus metrics, OTLP ingest and dispatch - send BetterDB data to your stack, or bring your traces in. Plus webhook alerts.
Live Grafana demo →Vector Workload Analytics
FT.SEARCH ops/sec and latency over time, per-index health with alerts for indexing failures, backfill progress, and deleted-doc growth. Built for teams running RAG and semantic search in production.
Vector Search
Inspect vector indexes, browse embeddings, and find semantically similar entries with similarity scores.
MCP Server
Full observability tools from any MCP-compatible client - Claude Code, Cursor, IDEs. Query your database and diagnostics in plain language.
View on registry →Inference Pipeline Latency
Per-operation P50/P95/P99 profiles for FT.SEARCH, reads, and writes. Per-index SLA thresholds with webhook breach alerts - know before users do.
Hot Key Tracking
Top-50 keys by access frequency with rank movement over time. Spot what's climbing before it becomes a bottleneck.
MONITOR Capture Sessions
On-demand MONITOR captures with live tail, filters, and value redaction. Trigger on anomalies, schedule with cron, diff two captures, and export JSON or CSV.
Latency Monitoring
Per-event latency history across P50/P95/P99. Know when your instance started slowing down, not just that it is.
CPU & I/O Threads
Per-thread I/O metrics and CPU utilization charts, including Valkey 8.x I/O thread breakdowns.
Migration
Analyze compatibility, move data, and validate results across Redis, Valkey, cloud, and self-hosted - in any direction.
Throughput Forecasting
Growth rate trend and ceiling-based ops/sec forecasting. Get alerted before you hit capacity, not after.
Valkey monitoring tools: an honest taxonomy
Different tools solve different problems. Here's where each one fits - including when it isn't us.
BetterDB
Valkey-first operational observability: persistent slowlog/COMMANDLOG history, client attribution, anomaly detection, hot keys, cluster heatmaps, and incident investigation.
When to use it (and when not) →Prometheus + Grafana (with an exporter)
General metrics infrastructure and custom dashboards across your whole stack. Complementary: BetterDB exposes 100+ Prometheus metrics, so it can be your Valkey-aware metrics source.
Full comparison →Redis Insight
Interactive database exploration and administration - browsing keys, running commands, one-off inspection.
Full comparison →Datadog / New Relic
Organizations that want Redis/Valkey metrics inside a broader commercial APM platform. Valkey coverage varies by integration.
Running Prometheus already? BetterDB and Prometheus/Grafana are complementary: keep your dashboards, add database-specific investigation. See the live Grafana demo →
Go deeper
COMMANDLOG monitoring
Beyond the slowlog: large requests and large replies on Valkey 8.1+.
Anomaly detection
How baselines, Z-scores, and correlated diagnoses replace hand-tuned thresholds.
AI-native observability
Let Claude or Cursor investigate your database over MCP - 60 tools, read-mostly.
Slowlog monitoring
The 128-entry ring buffer rotates away during incidents. Persist it, and analyze by pattern.
Cluster monitoring
Topology, migrations, failovers, and per-slot heatmaps via SLOT-STATS.
Hot key monitoring
One overworked key can saturate a node. Track the top 50 with rank movement.
Vector search monitoring
Per-index health and FT.SEARCH latency percentiles for valkey-search and RediSearch.
Self-hosted & air-gapped
Docker, Helm, or npm - down to fully offline with locally-verified licenses.
Prometheus integration
100+ betterdb_* metrics, scrape config, and nine ready-made Alertmanager rules.
OpenTelemetry
OTLP in both directions - app traces in, metrics and events out to any collector.
Built for humans and agents alike
Investigate incidents yourself with a full UI - or point your agent at BetterDB and walk away.
You investigate
Full dashboard, slowlog pattern analysis, anomaly detection, client attribution, and vector search - everything you need to find what went wrong and why, with data that persists beyond the log rotation.
Your agent investigates
Connect BetterDB's MCP server to Claude Code, Cursor, or any MCP-compatible client. Ask questions in plain language. Get back structured diagnostics - slowlog history, anomaly summaries, latency trends, ACL audit - without opening a browser.
{
  "mcpServers": {
    "betterdb": {
      "command": "npx",
      "args": ["-y", "@betterdb/mcp"]
    }
  }
}Valkey monitoring FAQ
What is Valkey monitoring?
Valkey monitoring is the practice of collecting and analyzing the health, performance, command activity, memory usage, client behavior, replication state, and cluster state of Valkey instances. It spans real-time metrics (is the database healthy now?) and historical observability (what happened during an incident?).
How is monitoring Valkey different from monitoring Redis?
Valkey is wire-compatible with Redis, so the basics (INFO metrics, SLOWLOG) carry over. But Valkey 8.x adds observability surfaces Redis does not have: COMMANDLOG (Valkey 8.1+) records large requests and replies in addition to slow commands, CLUSTER SLOT-STATS (Valkey 8.0+) exposes per-slot CPU and key statistics, and multi-threaded I/O exposes per-thread metrics. Tools built only for Redis cannot see any of these.
Does BetterDB work with Redis too?
Yes. BetterDB supports Valkey 8.0+ and Redis 6+, auto-detects which one it is connected to, and degrades gracefully: every feature works on Redis except the Valkey-exclusive COMMANDLOG and CLUSTER SLOT-STATS views.
Can I keep my existing Prometheus and Grafana setup?
Yes. BetterDB exposes 100+ Prometheus metrics from a /api/prometheus/metrics endpoint and ships Alertmanager rules, so it can act as a Valkey-aware exporter inside your existing observability stack. It also ingests and exports OpenTelemetry. A public Grafana demo built on these metrics (both Prometheus and OTLP datasources) is at demo-grafana.app.betterdb.com.
Does BetterDB monitor managed services like AWS ElastiCache?
Yes. ElastiCache, MemoryDB, Redis Cloud, and Upstash are supported, with SSH tunnels and an outbound-WebSocket agent for reaching VPC-only instances. Note that for cluster and Sentinel topologies behind a bastion, per-node views require direct network reachability to the nodes.
Can it run air-gapped or self-hosted?
Yes. BetterDB self-hosts via Docker, Helm, or an npm CLI, stores history in PostgreSQL or SQLite, and runs fully offline in air-gapped environments using signed offline license tokens that are verified locally.
Is BetterDB open source?
BetterDB is open-core: the core monitor is MIT-licensed on GitHub, while Pro features such as anomaly detection and key analytics are commercial - currently free during early access.
Still on Redis, evaluating Valkey?
BetterDB monitors both and includes live migration with a three-phase analysis, execution, and validation workflow - so your observability moves with you.
Ready to get started?
Start monitoring in minutes - no infrastructure to maintain. Team collaboration, agent-based monitoring for private databases, and more. Or self-host - open source core, zero lock-in.